Contents
First, a bit of context. One of Hiro’s products is the Stacks API. This is an open-source tool, and anyone can run their own instance of the API. Despite that, most people use ours, and today we service more than 400M monthly requests.
A lot of work has gone into scaling the API to meet that demand, and some of that work is covered by my colleague Charlie Cantoni in a recent post How to Scale a Blockchain API. You can also learn more about the API roadmap in a recent talk given by my colleague Rafael Cárdenas:
In this post, I would love to share how adding the ability to generate flame graphs on live production API instances helped identify areas for optimization for higher traffic throughput.
What Is a Flame Graph?
At a high level, a flame graph enables us to visualize the performance of different functions called to the API. In particular, a flame graph will visualize both the complexity of the function as well as the time taken by the API to process that function. With a flame graph, you can more easily identify functions that are both complex and time-consuming, indicating that a function is using too many CPU resources and should be optimized.
For more information on flame graphs, this article provides a helpful primer.
Goals for the Project
As mentioned above, the primary goal for this project was adding the ability to generate flame graphs for live production API instances in order to determine areas for optimization. We also had two secondary goals worth mentioning here:
- Provide flame graphs during API upgrade initializations that perform event-replay and Stacks 1.0 data imports. This would give us data and allow us to optimize the upgrade process speed. We want production environments to be able to upgrade via event-replay in a timely manner.
- Provide flame graphs for local development environment API initializations that perform event-replay in order to identify and optimize the process speed. We want API contributors to be able to reproduce and debug issues using event-replay in minutes rather than hours.
To achieve these goals, we needed the ability to select a given API instance—perhaps one with sudden unexpected high CPU, which could have been running for X hours/days/weeks—and generate a CPU profile report for that instance.
Profiling tools are not designed to run constantly in a live production environment: they introduce higher overhead, whether in the form of greater CPU usage, memory or disk space. Ideally, we want a solution that doesn’t require running constantly (so as to avoid incurring that overhead), and instead have a solution where we could simply toggle profiling on when we need to investigate an issue, collect that data, and then stop profiling and continue operating as normal.
Invasive Setups as a Non-Starter
It was also important that we avoided an invasive setup (such as those that require hosting your application as well). In most cases, invasive setups prevent us from achieving our goals of profiling a live instance on demand through two specific problems:
- Invasive setups often involve hijacking the startup process of the application. In other words, the app you want to profile must be started with a wrapper program and/or started with various diagnostics flags passed to the Node.js runtime. This introduces the ongoing overhead above, and along with increased cost could have runtime implications as well. It is impossible to turn profiling on when needed, and instead the profiler must run constantly alongside the app.
- The app must be killed in order to generate the report. This is a non-starter as well for a live production tool. We don’t want to halt the app entirely to get the data. Instead, we want to be able to diagnose and solve issues in real time without causing a service disruption to our customers.
In other words, we didn't want to have our API process lifecycle dependent on a profiling utility, nor do we want to introduce increased overhead for profiling constantly when the vast majority of the time, we don’t need profiling.
As I dove into finding a solution to meet these various needs, I was surprised by the lack of information and resources around profiling Node.js applications. Even stranger is the lack of documentation around some of the modern approaches that we cover later on.
To rectify that issue, I decided to share what I found in my own research. Here are the options we looked into at Hiro.
The Solutions We Investigated
NodeJS.org Diagnostics Guide
The approaches in these guides published by the Node.js project maintainers (1 and 2) impose constraints that make them non-starters for usage in a production environment. They both involve the issues of invasive setups described above: hijacking the startup process as well as killing the app in order to get the profile report.
Apart from these non-starter constraints, there are a number of other issues that make these two approaches less than ideal. For example, one of the approaches requires using perf, which is a Linux-only utility. This makes it difficult to perform profiling in a MacOS development environment, for example.
Tools like <code-rich-text>perf<code-rich-text> are also not Node.js-specific. This means special flags need to be specified when initializing the Node.js app in order for it to output CPU profiling data in a format that can be understood. Additional post-processing steps are then needed to translate the output into something more useful/readable in the context of JavaScript source code. The requirement to specify these special runtime flags and the additional steps to create useful output makes these approaches more painful to use in both development and production environments.
Lastly, the guides are not that helpful for manual "profile-guided optimizations" during local testing and development. For example, the Node.js docs for the Inspector API briefly mentions CPU profiling (see here). However, it’s far from a comprehensive guide, and surprisingly, other guides mostly contain the same information that is found in the official guides. Important information and context around the Inspector API can only be found in various GitHub issue discussions.
AWS CodeGuruProfiler
The major cloud services (Amazon Web Services, Google Cloud, Microsoft Azure) all have application profiling services, which generally work with the popular runtimes (Node.js, Java Virtual Machine (JVM), dotNET, Python, etc). It’s useful to see what they offer as a benchmark and whether they use any open source tooling that we could take advantage of without having to fully move our infrastructure into their service.
In the case of AWS CodeGuruProfiler, the tool is a pluggable library with integration with an AWS-hosted profiler service. Unfortunately, it doesn’t actually support profiling Node.js (only JVM and Python). AWS doesn’t mention why they do or do not support a particular runtime. Perhaps they do not support Node.js because it was historically difficult to profile in a non-invasive way.
This option was dead on arrival.
Google Cloud Profiler
This tool is a pluggable library and offers integration with a Google Cloud-hosted profiler service. Once your credentials are configured, this library is advertised as easy to use, requiring just this one line of code being added to your app:
However, after evaluation, we found that this library had cumbersome native dependencies. For example, the library uses a native (C/C++) module. Ideally, we want the API to support a variety of development and production environments (such as Linux, Alpine Linux, MacOS, Windows, x86, and ARM64).
To support this matrix, the library has to either a) ship pre-compiled modules for each of these environments or b) include scripts that are able to successfully compile the native code in each of these environments. In the case of Google's library, they ship a pre-compiled module for Linux and require other environments to build the module locally. This is a common source of bugs and annoyance for developers, especially with the introduction of M1 Macs, which broke many of these build scripts due to its lack of support for ARM64 architecture.
The profile data provided by this library is translated into Google's pprof format, which requires using their suite of tooling (see here). The format also excludes support for using the V8 ".cpuprofile" format that Chrome, Node.js, and VS Code all support.
Lastly, this library uses a native Node.js extension that leverages the existing profiling capabilities of the V8 engine, which are available in the more robust Inspector module (more on that below). In short, Google Cloud offered a possible solution for our needs, but the native dependencies made it an unattractive choice.
Inspector Module
This tool is a built-in module for interacting with the V8 inspector. This module is primarily used to power debuggers (e.g. VS Code) via the v8-inspector protocol (essentially a fork of the Chrome DevTools Protocol). However, a couple features make this module a candidate for providing profiling capabilities that meet our needs.
The inspector module provides the ability to programmatically and on-demand create an internal inspector session, interact with V8 APIs, then close down the session. During this session, full access to V8's CPU Profiler API is possible, which allows the collection and generation of a <code-rich-text>.cpuprofile<code-rich-text> report.
This is essentially the "canonical" JavaScript CPU profile report format. It can be inspected using Chrome's "DevTools for Node" (open the url chrome://inspect in Chrome):
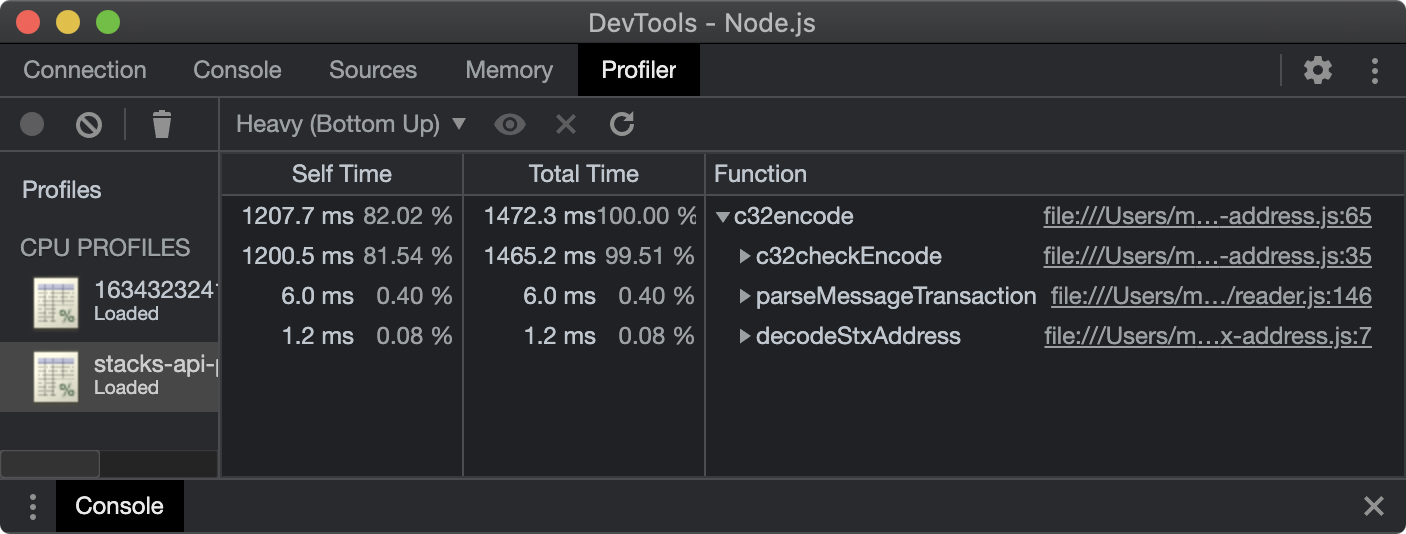
The report can also be inspected in VS Code (simply open the file).
Production Usage Viability
There is not a lot of documentation around this approach, and the approach only seemed recently viable. However, there's a lot of info in various GitHub issues. The issue "Node CPU Profiling Roadmap" was created in the Node.js repo in 2018 and only closed this year (in a sister/followup issue). The explicit goal of the issue was pretty much exactly what we're looking for:
[To] provide a powerful suite to debug and diagnose Node.js issues in production.
The issue also mentions the challenges around supporting "large critical production deployments." The benchmarks listed at the closing of the issue are promising. These are for initializing an internal inspector session, starting CPU profiling, and stopping the profiling (stopping generates the report):
These benchmarks are more than adequate. I anticipated latency spikes of a few seconds for a brief period (<1 minute) on a given API when CPU profiling was taking place. After further testing, we found these benchmarks to hold true in a production environment, and this is the solution we ended up picking. However, this approach does come with a few downsides.
Limitations of the Inspector Module
Native Stack Frames
The V8 profiler only captures details of JavaScript code. It does not capture details of native stack frames (e.g. C/C++ modules). For example, this report shows a process where most of the CPU time was spent in a native pbkdf2 function:
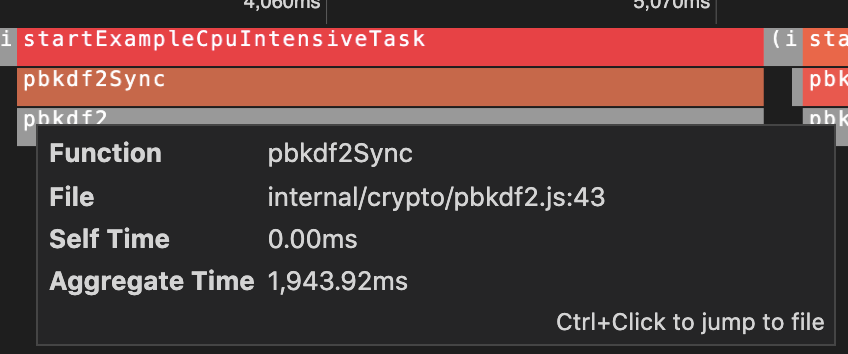
Once the function in <code-rich-text>crypto/pbkdf2.js<code-rich-text> calls into native code, we only see the native entry-point function name <code-rich-text>pbkdf2<code-rich-text> in gray. This would be a limitation for someone trying to optimize the internals inside of that native function.
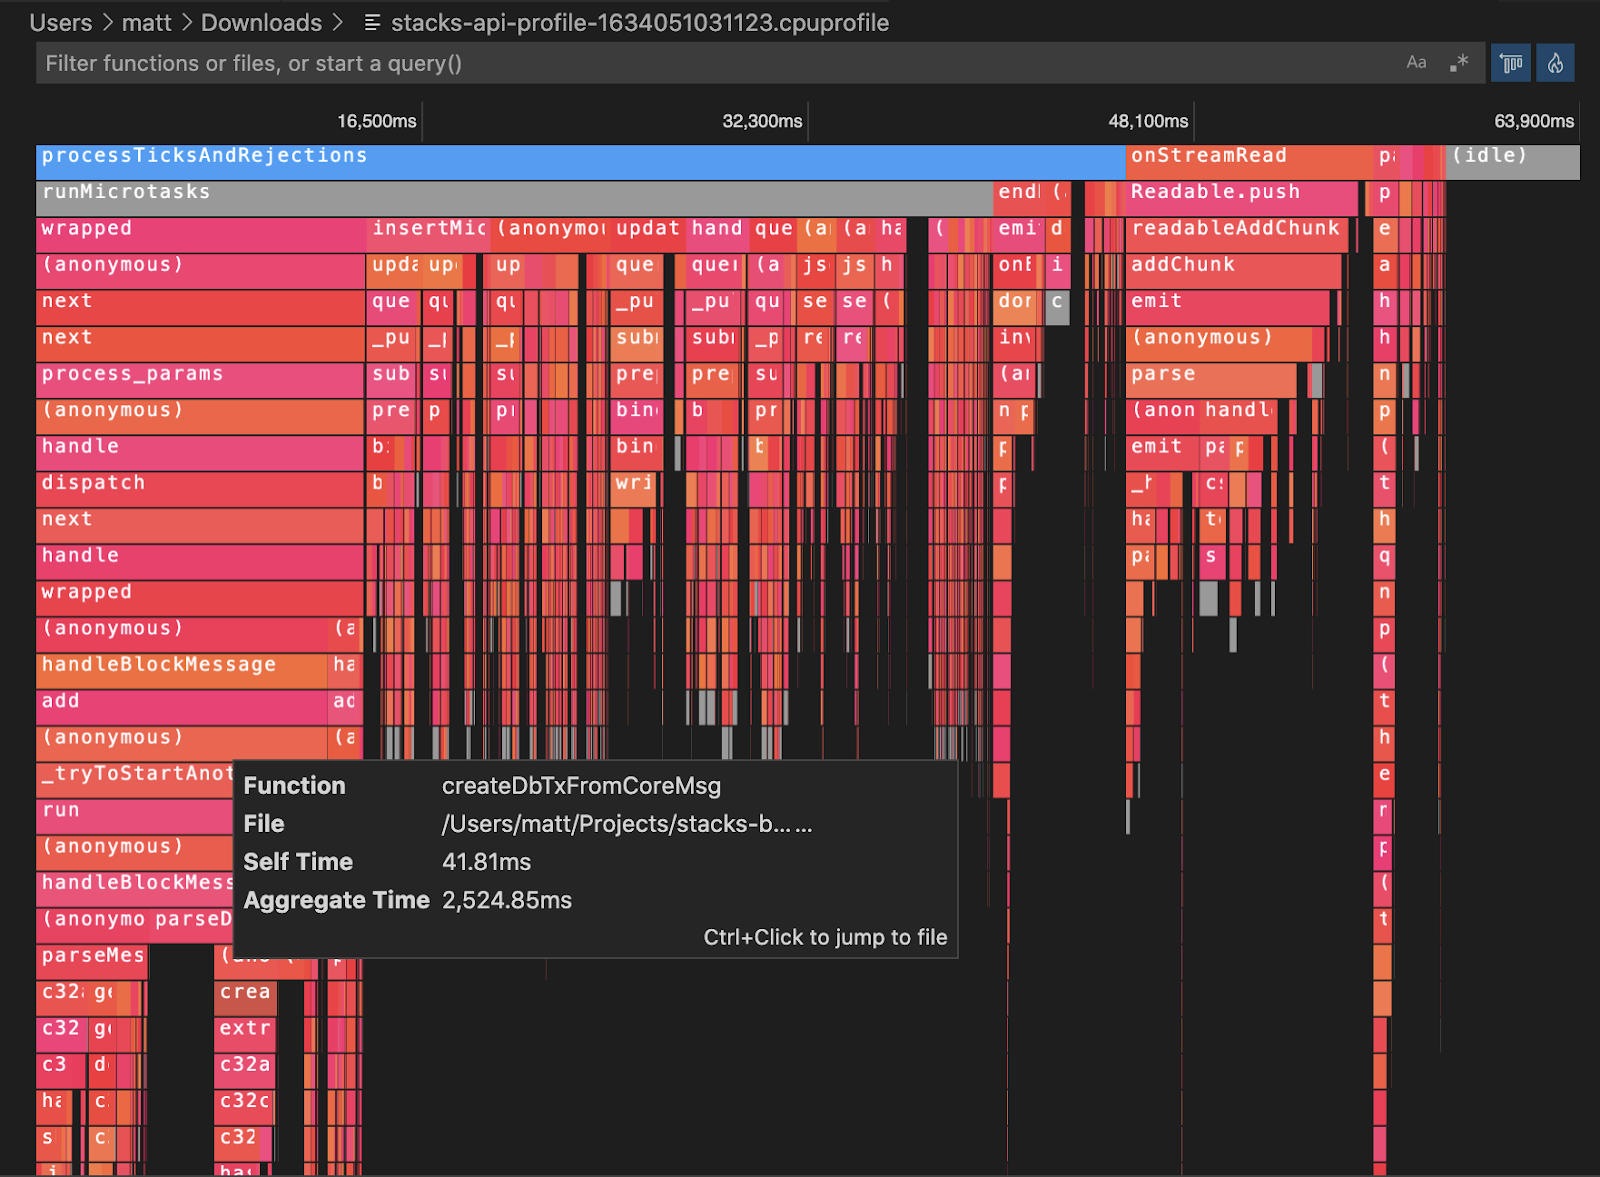
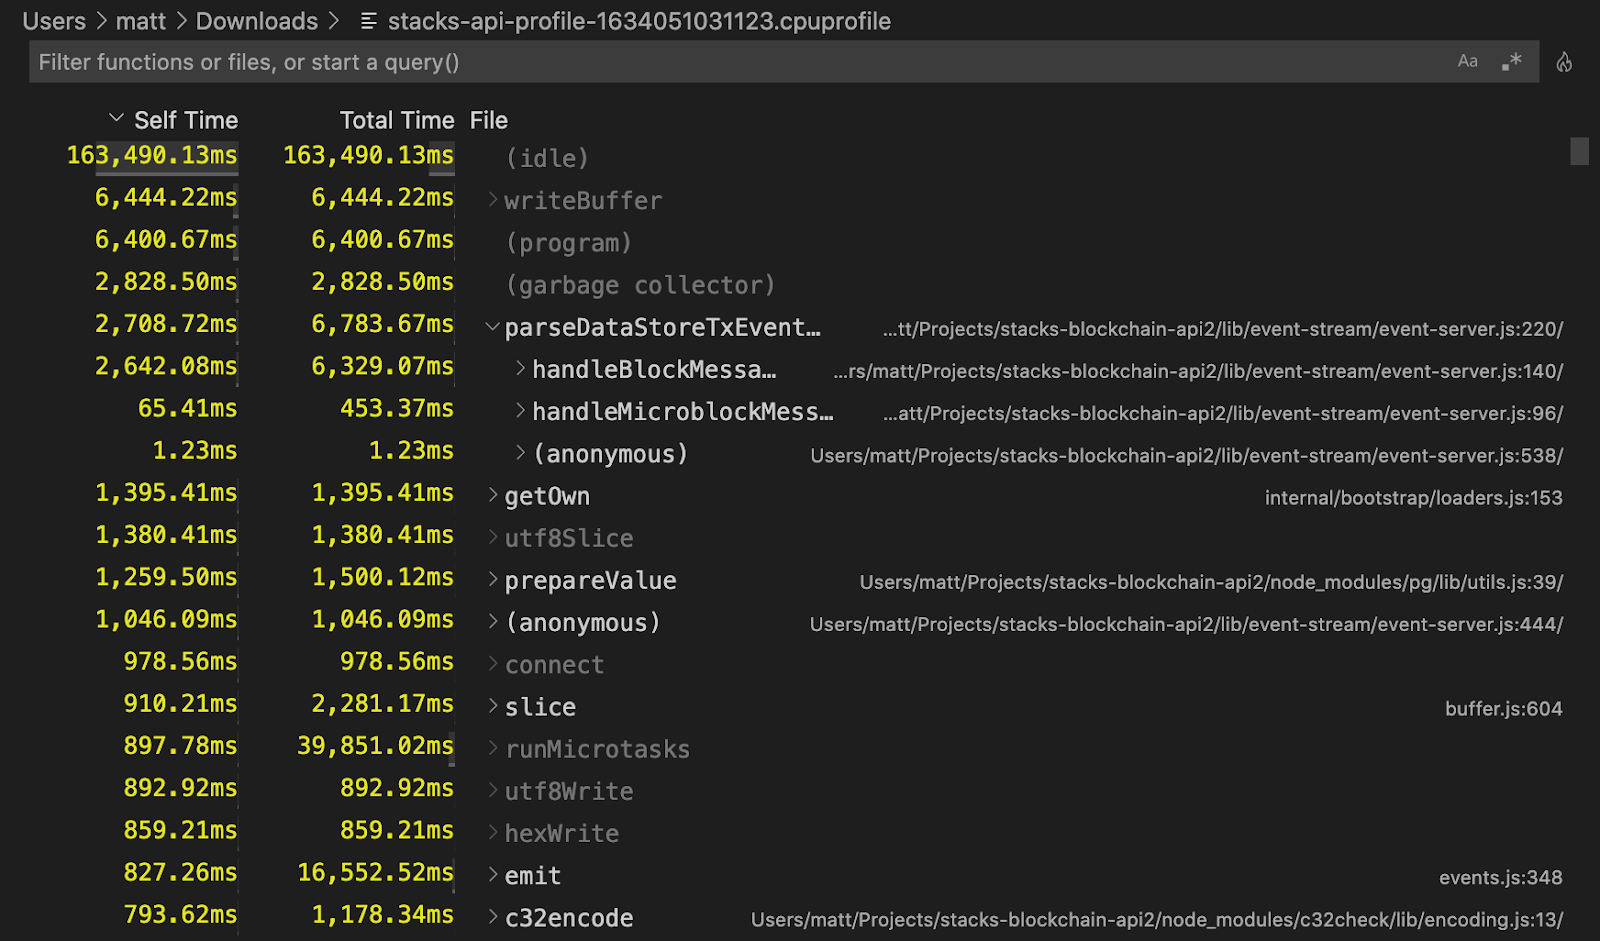
We determined this wasn’t an issue for us, as the Stacks API doesn’t perform a significant amount of CPU or complexity in native modules. Here's a section of a report generated for the API during event-replay:
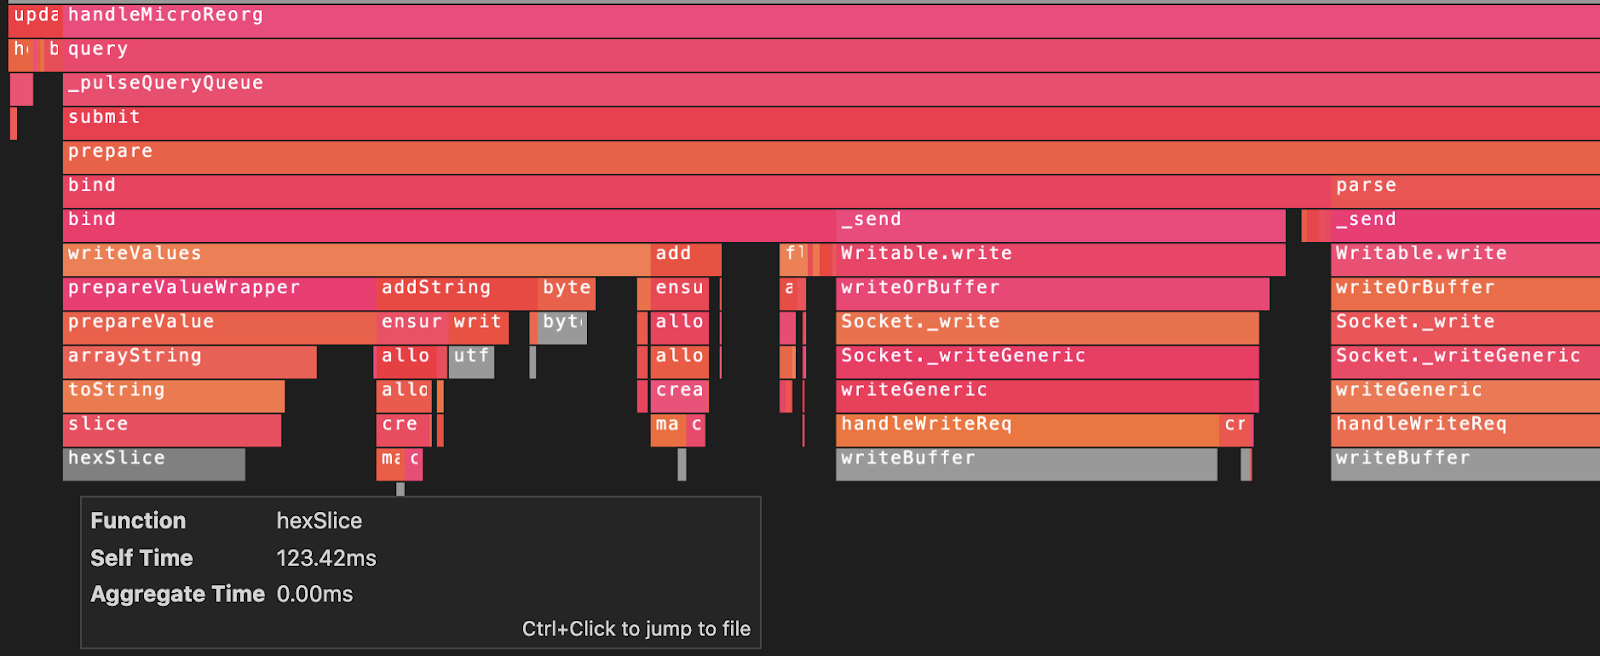
Native functions are not where the bulk of the time is spent — and where they are, the entry-point names are typically quite clear. For example, the above report points to a potential optimization where less buffer hex string operations should be performed (the grey bars).
Async/await
Async functions do not show up in reports. For example, a significant amount of wall-time (real time) is spent "awaiting" on async Postgres queries. However, async functions are merely syntax sugar for callbacks (promise state machines), and no actual CPU time is spent "awaiting." A long running async function waiting IO like a Postgres query does not contribute to the system CPU usage metrics.
It would be nice if it was possible to toggle a display of time spent in async functions to give us more insight into Postgres queries at the Node.js application later. But it would not help with optimizing real pod CPU usage.
For more context, see this proposal on GitHub.
Source Mapping
The CPU report does not automatically translate to the .ts TypeScript source. The data is generated against the compiled JavaScript source, and the line numbers and file paths point to the compiled JavaScript files.
In practice, this is only a mild inconvenience for our usage at Hiro. We compile our TypeScript to modern JavaScript, which is nearly identical in output, and it's trivial to match any of the JavaScript to the TypeScript source (as opposed to the obfuscated JavaScript you might see generated by babel for 2010-era web browser usage).
Note that Google's profiler library appears to support source map translation — perhaps if the report format is similar enough we could leverage that code if needed.
Implementing the Inspector Module Profiler
Typically, process signals are used to trigger debugging and profiling capabilities (e.g. SIGUSR1). However, this doesn't provide a way to send additional information like a session duration. It would also require shell access to the pod as opposed to only network access.
An approach that addresses both of those issues is to expose profiler capabilities through http endpoints (on a new private port). This is the setup that we chose (see the GitHub PR), and these endpoints allow CPU and memory profiling samples to be easily generated and downloaded (e.g. curl commands) on-demand.
The new "profiler" http server can be enabled by using the <code-rich-text>STACKS_PROFILER_PORT<code-rich-text> environment variable. This exposes a few endpoints for generating CPU and heap-memory profiling reports, including:
GET /profile/cpu?duration={seconds}
This endpoint Initializes an in-process <code-rich-text>inspector<code-rich-text> session and enables CPU sampling. After the given duration, the endpoint closes down the session and returns the resulting <code-rich-text>.cpuprofile<code-rich-text> report file in the http response.
The most effective way to analyze this report is to simply open the file in VS Code which has built in support with tree views and flame charts.
The report can also be viewed in Chrome by going to the url chrome://inspect, selecting "DevTools for Node" > "Profiler" > "Load".
Here’s a sample return from the endpoint, with the first line being the command, followed by the output.
Conclusion
That’s how we added CPU profiling and flame graphs to the Stacks API. If you’re exploring implementing a Node.js profiler, I hope you found this guide helpful.
If you're looking to jumpstart your Web3 development, download our guide to developing smart contracts to better understand how the API fits into the Web3 tech stack.